I had coffee last fall with the founder of a financial advisory firm — sixty-five employees, thirty-two years in business, the kind of company that has been part of her town long enough that the second generation of clients is now showing up.
Her revenue was at an all-time high.
She told me she couldn't sleep.
"Something is off and I can't pin it down. The numbers say we're winning. But I sit at my desk and feel like we're losing ground I haven't lost yet."
I asked her one question. When was the last time a new client walked through your door because someone you served said your name first?
She paused. Then she started counting backward through the quarter. Then through the year before that. And her face changed.
The revenue was up. The referral velocity was down. Her reputation wasn't gone. It had stopped compounding. And the trajectory she was watching — the P&L — was the last place that would tell her.
Last week I introduced the Integrity Yield. It is a directional metric that captures the return generated by values-aligned decisions over time. It is slow. It is annual. It is patient.
This week's instrument is faster. And it answers a different question.
Not "did our values pay us back," but "is the trust those values built getting stronger — or weaker — right now?"
I call it Trust Velocity.
Why Trust Behaves Like a Compounding Asset
Trust isn't a number. It's a slope.
When a small business operates with consistent integrity, trust accumulates. Each delivered promise earns a deposit. Each problem handled with care earns a deposit. Each public moment that confirms what the company says about itself earns a deposit. Those deposits compound, because the people they accrue to talk to other people, and those people talk to other people, and the reputation arrives in rooms the company never entered.
When integrity slips — even quietly — trust does not stay flat. It depletes. Each broken promise is a withdrawal. Each policy enforced inconsistently is a withdrawal. Each AI-mediated interaction that drifts from the brand's voice is a withdrawal. The compounding goes the other way. Friends warn friends. Suppliers wait. Talent stops applying. The decline is rarely visible inside a quarter. It is plainly visible across two years.
Compounding trust is the most powerful asset on a small business's balance sheet — and it doesn't appear on the balance sheet.
Eroding trust is the most expensive liability — and it doesn't appear on the balance sheet either.
The Trust Velocity Index makes both visible while there is still time to do something about it.
What Trust Velocity Measures
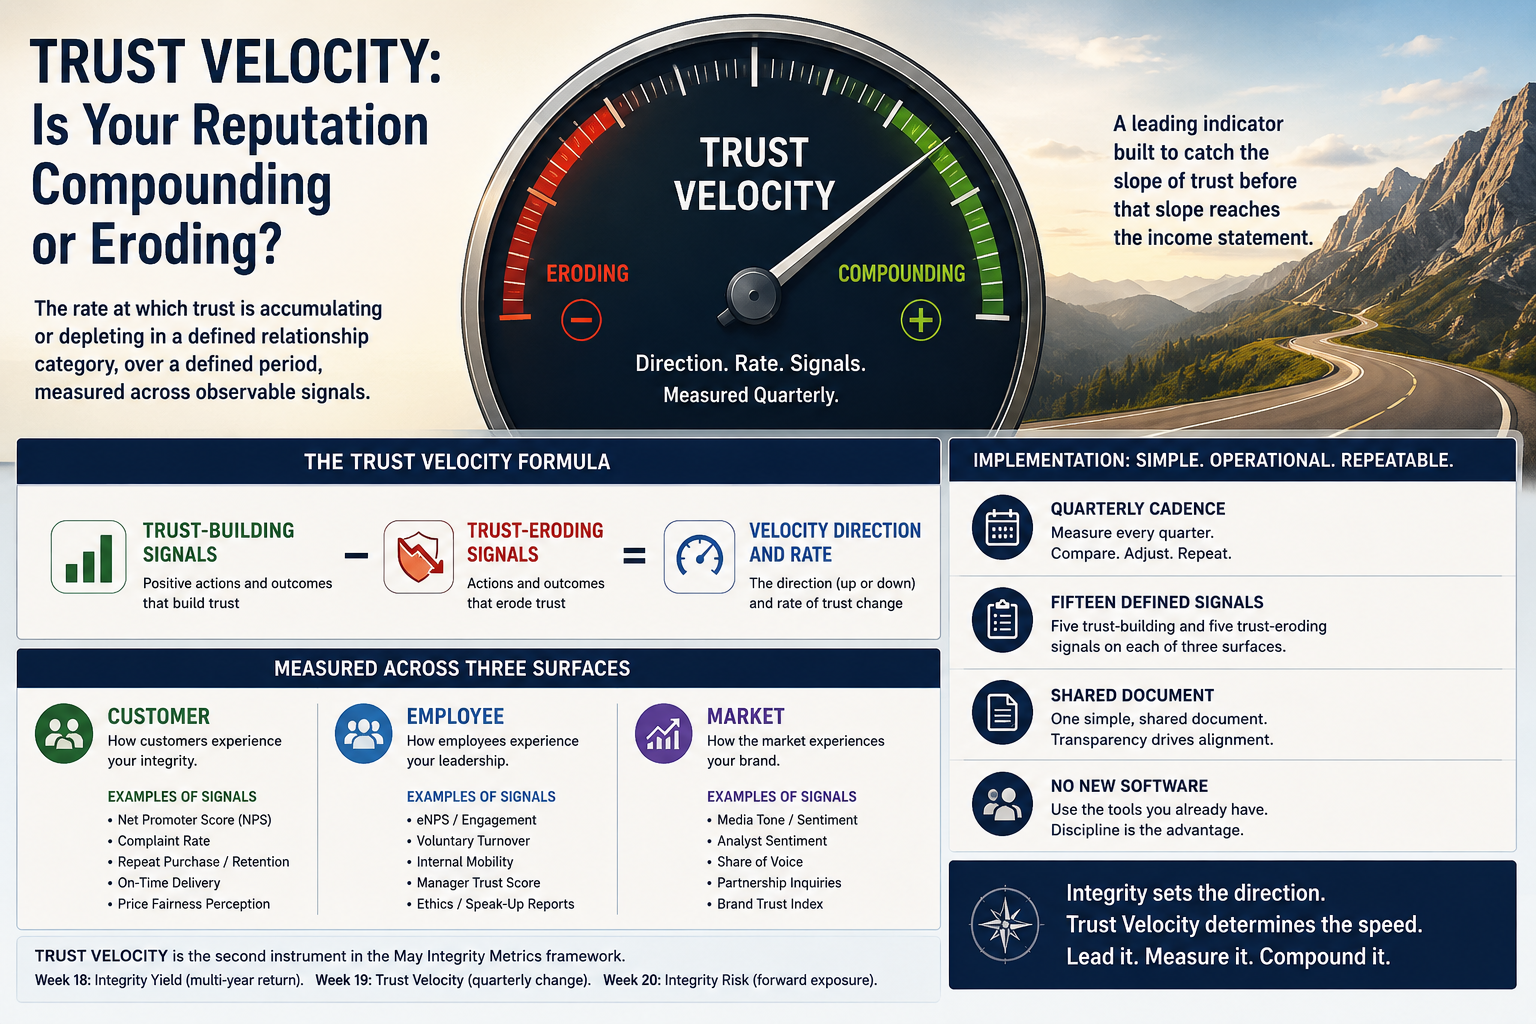
Trust Velocity is the rate at which trust is accumulating or depleting in a defined relationship category, over a defined period, measured across observable signals.
The metric has three components.
1. Trust-Building Signals — The Deposits
These are observable indicators that trust is accruing. Most of them are silent in any given week and unmistakable across a quarter.
Unsolicited referrals. Repeat purchase rate. Customer expansion — existing clients buying additional services without prompting. Employee referrals into open roles. Partner inquiries that arrive cold and warm at the same time. Press mentions and citations the company didn't pitch for. Time-to-yes on proposals. Voluntary contract renewals that open before the renewal window did.
You're not counting all of them. You're tracking which way they're moving.
2. Trust-Eroding Signals — The Withdrawals
These are observable indicators that trust is leaking. Most are quiet enough to be filed under "noise" until you put them next to each other.
Refund requests. Churn inside the first ninety days. Complaints that escalate past the first contact. Renewals that hesitate. Hiring loops that lengthen because referrals stopped flowing. Press mentions the company didn't want. Public reviews that name the same friction point twice in a quarter. Partner relationships that go quiet without explanation.
Again — direction, not count.
3. Velocity Direction and Rate — The Slope
The first two components are inputs. The third is the answer they produce.
Take the deposits and the withdrawals from a defined quarter. Compare them to the same surface a quarter ago. And the quarter before that. The pattern is the velocity. Compounding means deposits are growing faster than withdrawals. Eroding means withdrawals are growing faster than deposits. Stable means the relationship between the two has held — which in a competitive market is more fragile than it looks.
A small business that misreads stability as health is a small business about to be surprised.
The Three Surfaces
Trust isn't monolithic. It compounds and erodes on different surfaces at different rates. Measure across at least three.
Customer Surface. Referral volume. Retention rate. Expansion behavior. Unsolicited testimonials. These are the lagging indicators most leaders eventually find — usually after the slope has already turned.
Employee Surface. Internal referrals. Voluntary tenure. Application volume from candidates who name your company by reputation. Glassdoor cadence. These move six to twelve months before customer signals do. Your team is the earliest market for your reputation.
Market Surface. Inbound partnership inquiries. Press mentions. Industry citations. Speaking invitations. Vendor courtesy — whether suppliers extend you favorable terms because of who you are, or only because of what you pay. This is the slowest surface to change. And the hardest to manufacture artificially when the other two are weakening.
When all three surfaces are moving the same direction, the signal is unambiguous.
When they disagree, the surface that's weakening first is the early warning. The customer surface usually moves last. The employee surface usually moves first. If your team has noticed something the market hasn't yet — that is the moment to act.
How to Build a Trust Velocity Index
You do not need new software. You need a quarterly rhythm and a shared document.
Step one. Pick five signals per surface — fifteen total. Choose the ones most observable in your operation. Define each one in a sentence. Make sure each is countable, even if imprecisely.
Step two. Baseline the trailing quarter. Count where each signal sits today. This is your zero point. You are not grading the absolute numbers. You are establishing a starting place from which direction becomes visible.
Step three. Recount each quarter. Same fifteen signals. Same definitions. Same surfaces. Mark each as up, flat, or down against the prior quarter. Trend over three quarters before drawing a conclusion. Single quarters lie. Three quarters tell the truth.
Step four. Surface it next to the financial review. Put the Trust Velocity reading in the same room as the revenue review. Ask the leadership question the revenue review cannot answer: are we earning the next quarter — or spending the trust that built the last one?
What Trust Velocity Changes
The advisory firm founder I started with now runs a Trust Velocity Index. Three surfaces. Fifteen signals. One quarterly walk-through.
In her second quarter of tracking, the employee surface flashed first. Internal referrals into open roles had dropped by half in two quarters. Her team had stopped pulling people into the building. They hadn't said anything. They had just stopped.
She paused her growth plan. She held a series of conversations she hadn't been holding. She caught a drift in how her firm was handling a particular kind of client engagement that her senior people had been quietly uncomfortable with for nearly a year. She reset the standard. The employee surface stabilized within two quarters. The customer surface began compounding again three quarters after that.
She told me later: "If I'd waited for the customer numbers to move, I'd have lost two more years before I knew the price."
That is what Trust Velocity does.
It does not give you a number. It gives you a slope. And in a small business, the slope is the truth the dashboard is hiding.
The Bigger Shift
Most small businesses have been taught to manage by lagging indicators because lagging indicators are easy to count. Revenue. Margin. Headcount. Pipeline. They register cleanly. They show up on time. They feel objective.
Trust does not behave that way. Trust is a leading indicator that hides inside lagging surfaces until the trend is too far along to reverse cheaply. The Trust Velocity Index moves the question forward — from what did we earn last quarter to what is our reputation doing right now, while no one is watching.
The Integrity Yield, from last week, tells you whether the values you defended are paying you back over years.
The Trust Velocity, this week, tells you whether the trust those values built is compounding or eroding inside a quarter.
The Close Call Log, next week, will tell you the third thing the dashboard never tells you — the crises that didn't happen because integrity was operating.
A small business that watches its Trust Velocity is a small business that catches drift while there is still time to absorb the lesson cheaply.
Trust compounds quietly. It erodes the same way.
The leaders who win the next decade will be the ones who learned to read the slope before the slope reached the income statement.
Make today your masterpiece. And start watching the slope.